Find out how many years it takes to recoup Tesla Powerwall costs in a typical UK 3-bed house with solar panels.
Tesla Powerwall payback time in a UK 3-bed house with solar is typically around 8-12 years, depending on solar size, household consumption, and export tariffs prevailing at installation.
On this page
- The short version
- Typical solar energy generation for a UK 3-bed house
- Average electricity consumption for a 3-bed UK home
- Tesla Powerwall installation and running costs
- Calculation of estimated payback time based on current UK tariffs
- Tesla Powerwall payback in UK house with 3 bed solar
- Comparing solar and battery systems for payback and installer quotes
- Questions people still ask
Part of our guide on what happens when installing solar battery
Estimate how many years it takes to recover Tesla Powerwall costs for a typical UK 3-bedroom solar home with precise local data.
| Solar output | 2500-3500 kWh/year |
|---|---|
| Electricity use | 3000-4000 kWh/year |
| Powerwall capacity | 13.5 kWh |
| Powerwall cost | 10,000 |
| Export tariff | 4-6p/kWh |
| Payback estimate | 8-12 years |
The short version
- Average UK 3-bed solar output ranges 2500-3500 kWh/year
- Typical electricity use in such homes is 3000-4000 kWh/year
- Powerwall installation costs about £8000-£10,000 including setup
- Current export tariff averages 5.5p/kWh but varies widely
- Payback depends heavily on solar self-consumption and export rates
Typical solar energy generation for a UK 3-bed house
A 3-bedroom UK home typically has about 3-4 kWp of solar panels installed. Under average UK conditions, this system produces between 2500 and 3500 kWh annually depending on location and orientation. Solar output is higher in southern England closer to 3500 kWh and lower in northern Scotland near 2500 kWh.
The generation fluctuates seasonally with 75-85% of production occurring from March to September. Daily production peaks around midday, with little to no output early morning and late afternoon.
If your roof pitch or shading reduces efficiency, expect the lower end of the range. Larger solar arrays above 4 kWp increase output but may face diminishing returns on export savings.
In some parts of the UK, solar generation can be affected by local microclimates. For example, urban areas with more pollution or frequent fog may see solar output reduced by 5-10% compared to rural locations with clear skies. This local variation impacts the annual kWh yield and thus the financial return from battery storage. If that sounds like your situation, read up on solar panels cost uk 2026 for a 3 bed house next.
A worked example: a 3.2 kWp system in southern England facing due south with no shading might generate 3400 kWh annually. Of that, about 1200 kWh could be surplus midday solar that would otherwise be exported. Storing this surplus with a Powerwall increases self-consumption and reduces grid import. These figures serve as a check against overly optimistic or pessimistic estimates of solar yield.
Average electricity consumption for a 3-bed UK home
UK houses with three bedrooms typically consume between 3000 and 4000 kWh of electricity annually, depending on household size, appliances, heating method, and lifestyle.
Homes heated mainly by electricity tend toward the upper end of consumption, possibly exceeding 4000 kWh annually, while those with gas central heating use less. There is more on uk home battery cost and savings in a separate guide.
Daytime usage varies widely; appliance-heavy families use more, while those conscious of energy efficiency consume less. Evening peaks often occur around 6-9 pm.
Smart meters now common across the UK help track daily consumption patterns, which are vital to estimating battery savings accurately.
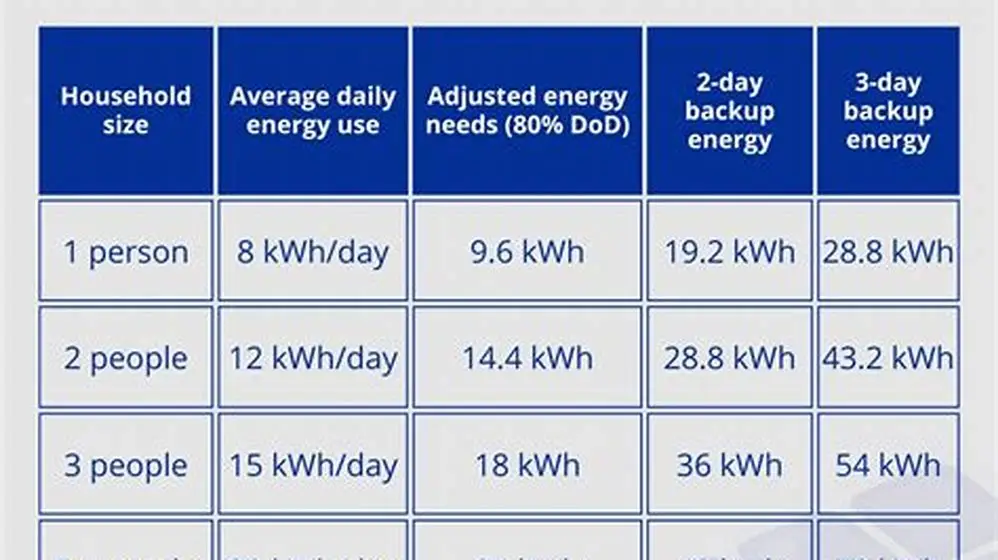
Electricity consumption in a 3-bed home varies by lifestyle factors such as the number of occupants and appliance efficiency. A family of four using electric cooking, lighting, and multiple devices might consume 3800 kWh/year, while a couple with energy-efficient appliances might use closer to 2800 kWh/year. If that sounds like your situation, read up on deciding battery size next.
Daily consumption profiles shape battery benefits. If a household’s peak demand occurs during evening hours, a battery like the Powerwall can shift daytime solar energy to meet this demand. Conversely, if most consumption happens during the day when solar panels generate power directly, the battery adds less value.
An example: a household consuming 10 kWh daily with 6 kWh used during solar production hours and 4 kWh in the evening would benefit more from a Powerwall than one that uses 9 kWh during the day and just 1 kWh at night. This difference affects the payback calculation substantially.

Smart Home Energy Monitor with 16 50A Circuit Level Sensors
Monitors real-time power usage with 16 sensors and tracks electricity cost, suitable for detailed household electricity use
Tesla Powerwall installation and running costs
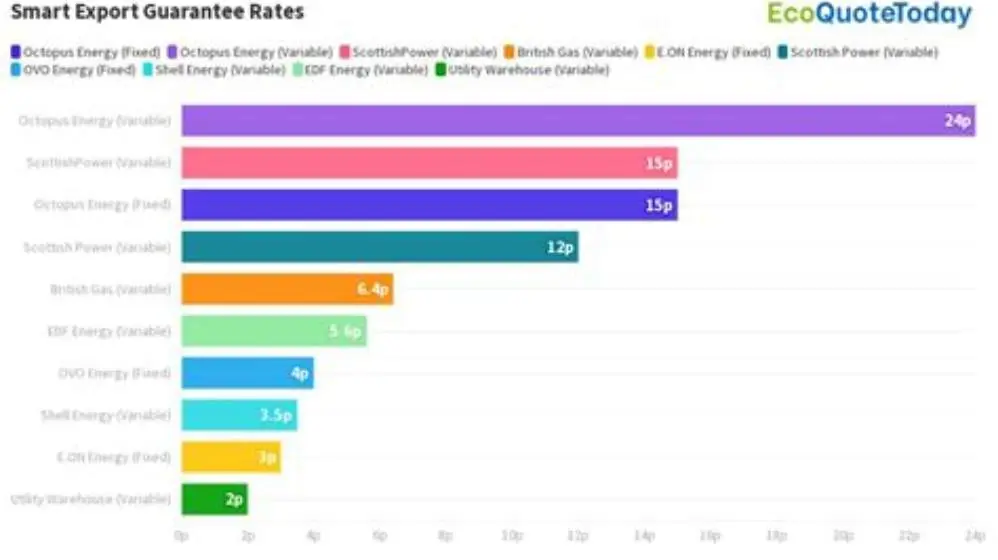
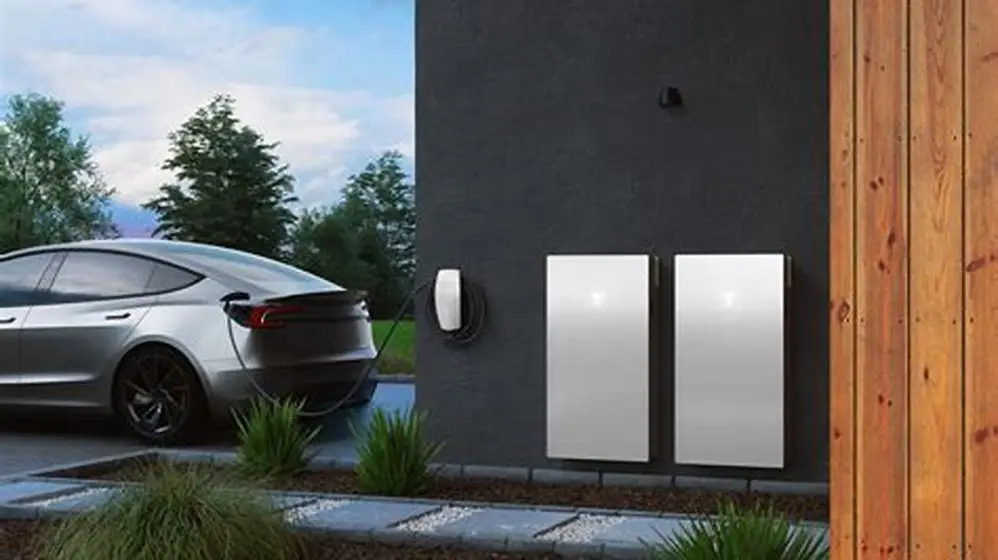
A Tesla Powerwall battery stores up to 13.5 kWh of electricity, enough to cover typical overnight electricity use for a 3-bed household. It helps to understand smart export guarantee rates compared before going further.
The installation cost in the UK currently ranges between £8,000 and £10,000, including hardware, inverters, wiring, and labour. Variations depend on installer rates and site specifics.
Running costs are minimal since the Powerwall requires little maintenance, but inverter replacements or warranty extensions may add costs beyond the 10-year warranty.
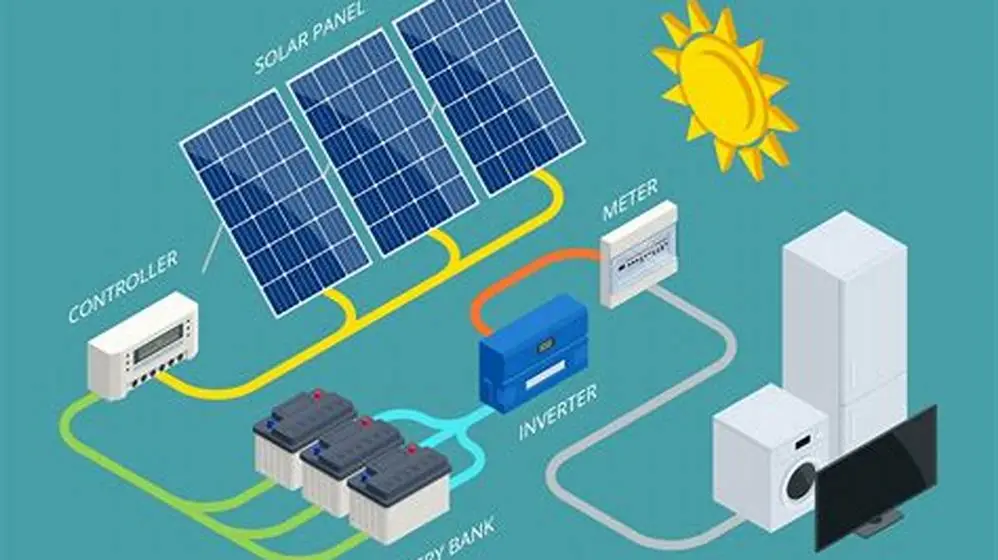
Some homeowners combine Powerwall with solar system upgrades or home energy management systems, which can increase upfront costs but improve efficiency. We go through working of solar batteries step by step elsewhere on the site.
Installation costs vary with factors like the existing electrical system, roof access, and whether additional equipment such as new inverters or communication hubs are needed. In some cases, Powerwall installation may require upgrades to a home's electrical panel, adding £500-£1000 to costs.
The Tesla Powerwall’s 10-year warranty covers defects and guarantees at least 70% capacity retention. After this period, battery capacity and efficiency decline, reducing energy stored and thus savings. Planning payback within warranty life is advisable.
Homeowners should also consider potential costs for replacing the inverter, typically around £1000-£1500 after 10-15 years, which may coincide with battery replacement. These future costs impact long-term financial returns and should be factored into payback estimates.
Calculation of estimated payback time based on current UK tariffs
Calculating Tesla Powerwall payback starts with assessing how much solar energy you use versus export to the grid. The battery stores surplus solar energy for use during evenings and nights, reducing grid electricity purchases.
The average export tariff for small-scale solar in the UK currently ranges between 4p and 6p per kWh, while typical domestic electricity import tariffs are around 28p to 34p per kWh. Using stored solar energy offsets the higher import cost.
Assuming a 3.5 kWp solar system producing 3200 kWh/year, and a home using 3500 kWh/year, you might self-consume 40-50% without a battery. The Powerwall can raise self-consumption to 70-80%, saving approximately 700-1000 kWh annually at the import tariff rate.
Dividing the typical £9000 Powerwall cost by annual savings of £250-£300 gives a payback of roughly 8-12 years. Actual payback depends on your solar output, consumption, tariff changes, and battery degradation over time.
| Solar size (kWp) | Annual solar kWh | Annual savings (£) | Estimated payback (years) |
|---|---|---|---|
| 3.0 | 2600 | £220 | 10-13 |
| 3.5 | 3200 | £270 | 8-11 |
| 4.0 | 3500 | £300 | 7-10 |
Tesla Powerwall payback in UK house with 3 bed solar
Combining all factors, the Tesla Powerwall payback period in a typical UK 3-bedroom solar home is most often between 8 and 12 years. This calculation assumes average solar production of 3000-3500 kWh/year and electricity consumption near 3500 kWh/year.
If your home consumes more electricity during daylight hours, or if your export tariff drops, the battery returns value faster by increasing solar self-consumption. Conversely, low solar output or high grid export payments extend the payback.
Financial incentives like the Smart Export Guarantee may influence export payments but currently do not significantly shorten payback. The Powerwall’s 10-year warranty matches the typical payback window.
For the Powerwall to make financial sense, your solar system must be suitably sized to generate excess electricity daily, and your household consumption profile must allow effective use of stored energy.
Comparing solar and battery systems for payback and installer quotes
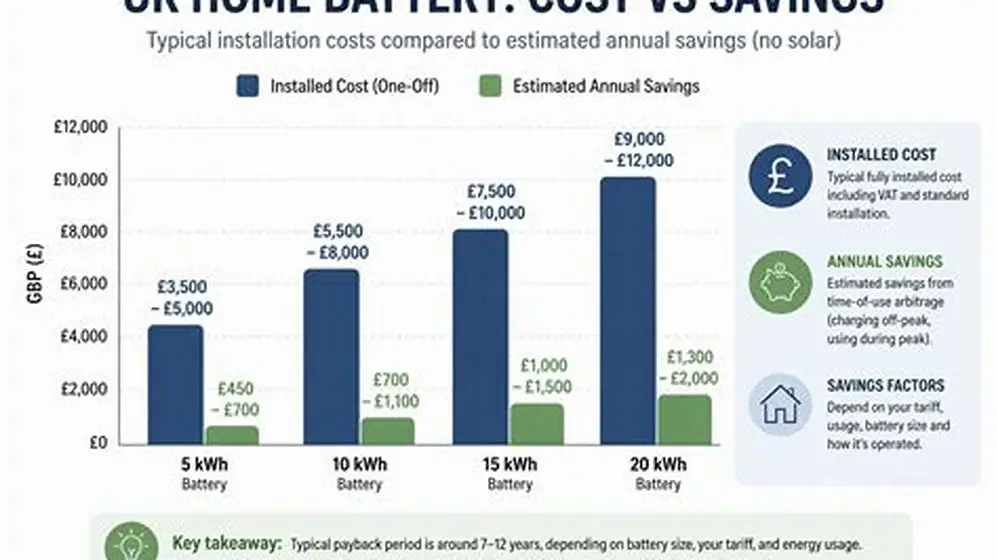
When considering a Tesla Powerwall, compare with other battery brands and system sizes. Smaller batteries cost less but save less energy; larger ones deliver more savings but cost more.
Traditional solar-only systems have shorter payback periods, often 6-9 years, because upfront costs are lower and export tariffs supplement income.
Different installers offer varying package prices, warranties, and aftercare. Obtaining at least 3 detailed quotes ensures you understand installation quality, component brands, and total costs.
Some installers offer maintenance plans or integrate heat pumps for further energy savings. Ask about these options to weigh combined long-term benefits against cost.
Grant schemes like the Boiler Upgrade Scheme or ECO4 currently do not cover batteries directly but may reduce overall household energy costs, improving financial calculations.
| System type | Typical cost (£) | Annual savings (£) | Payback range (years) |
|---|---|---|---|
| Tesla Powerwall 13.5 kWh | 8,000-10,000 | 250-300 | 8-12 |
| Smaller battery 5-7 kWh | 4,000-6,000 | 120-180 | 10-15 |
| Solar only 3.5 kWp | 5,000-7,000 | 350-400 | 6-9 |
- increases solar self-consumption
- provides backup power option
- reduces grid electricity purchases
- high upfront cost
- long payback period
- depends on solar surplus
Questions people still ask
Can I improve Tesla Powerwall payback by using more electricity during the day?
Using more electricity while your solar panels generate reduces export and increases self-consumption. This lessens the battery’s value, as it stores less surplus, potentially extending payback time.
Does the Smart Export Guarantee tariff affect payback time significantly?
Export tariffs under the Smart Export Guarantee vary but typically range 4p to 6p per kWh, which is much lower than import tariffs. Thus, higher export payments alone rarely shorten battery payback significantly.
Will adding a Powerwall increase my home's EPC rating?
Batteries themselves do not directly improve EPC ratings, which focus on energy efficiency measures and heating. But reducing grid electricity use can indirectly help energy efficiency scores over time.
Is the Tesla Powerwall suitable for homes without solar panels?
Without solar panels, the Powerwall stores grid electricity, which is usually more expensive and less environmentally beneficial. Payback times will be much longer or negative unless combined with special tariffs.
How does battery degradation affect the payback period?
Over its 10-year warranty, Powerwall capacity may degrade about 10-15%. Less capacity means smaller savings, potentially lengthening payback if solar generation and consumption remain unchanged.